
Settings
Chart settings let you configure how candles, crosshair, orders, status bar, screener densities, and indicators are displayed.
General settings
General settings are mostly self-explanatory; below is a detailed description of each.
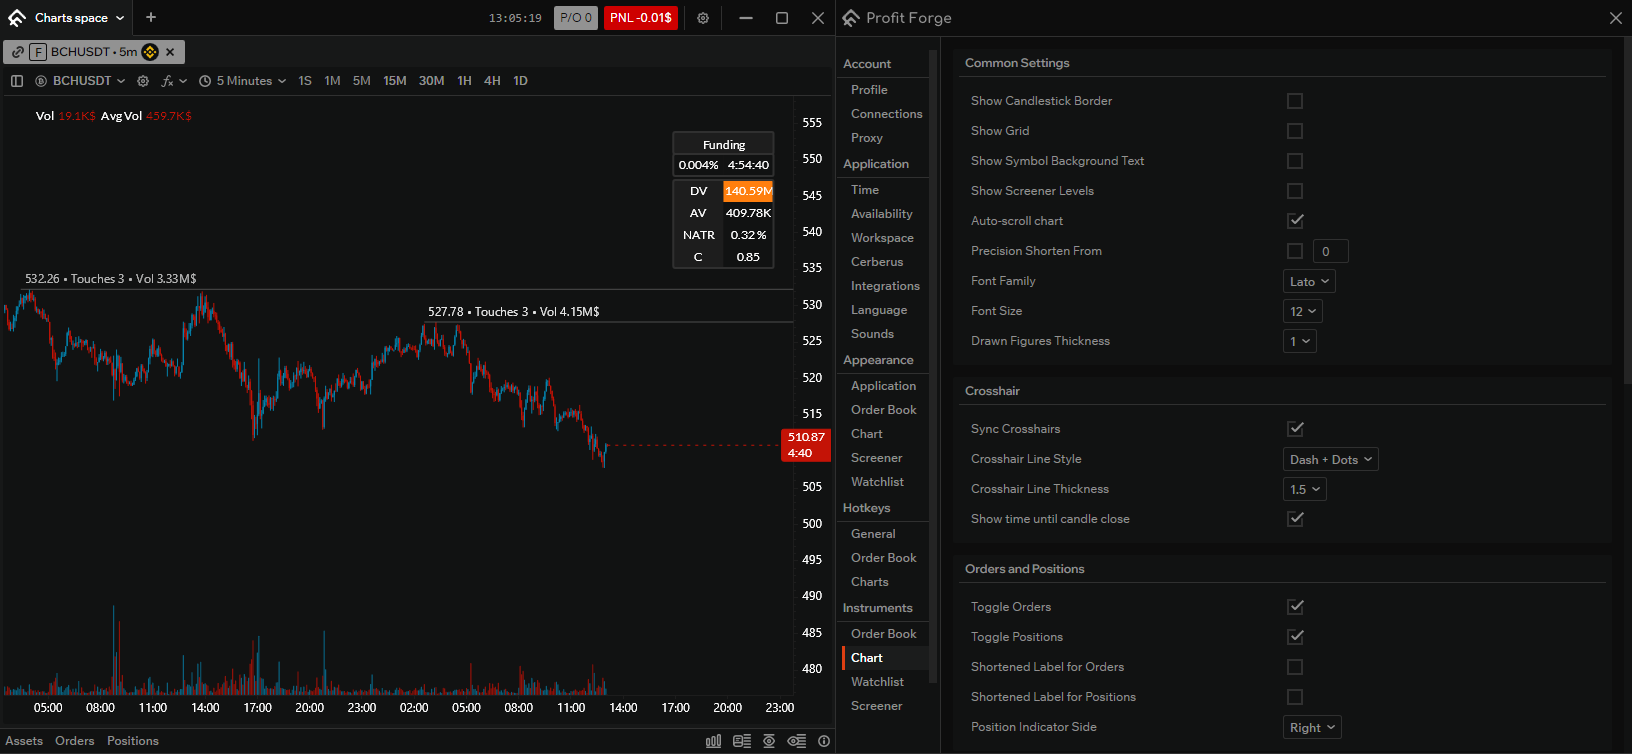
Show candle border — when enabled, a border is drawn around candles; the border colour can be configured.
Show grid — draws a grid on the chart to make it easier to read price and time.
Show ticker in background — when enabled, the ticker, exchange, market type, and timeframe are shown in the chart background.
Show screener densities — when enabled, the screener is synced with the chart; if a density exists for the pair, it is shown on the chart.
Chart auto-scroll — when enabled, the chart scrolls automatically so that there is free space to the right of the candles and the latest candle stays visible. If the chart is scrolled left and the latest candle is not visible, auto-scroll does not run.
Precision shorten from — when the checkbox is enabled, numbers on the chart are shown with trailing zeros after the decimal shortened. The field sets the threshold: at 0, all trailing zeros are shortened. For example, 0.001 is shown as (2)1 — the number in brackets is the count of zeros removed, followed by the significant part.
Font — choose any font installed in Windows (including custom fonts).
Font size — choose any font size; sets the height of text on the chart.
Drawn figures line width (pixels) — sets the thickness of crosshair lines, levels, and other figures in pixels.
Crosshair
Crosshair (cursor) settings on the chart.

Crosshair sync — crosshairs are synced across charts for the same pair (e.g. 1m, 5m, 1h, 4h): moving the cursor on one chart shows the crosshair on the others.
Crosshair line style — four options: solid, dashed, dotted, dotted and dashed; controls the look of the horizontal and vertical crosshair lines.
Crosshair line thickness — thickness of the crosshair lines in pixels.
Time to candle close — the label for the current price on the latest candle shows the time until that candle closes.
Orders and positions
Settings for how orders and positions are shown on the chart.

Show orders — show executed orders on the chart.
Show positions — show current and past positions; updates when a new position appears.
Short labels for orders — shortens labels (e.g. LIMIT → L).
Short labels for positions — shortens labels (e.g. SHORT → S).
Position info side — choose whether position information is shown on the left or right of the chart.
Status bar
Controls the information shown in the top bar of the chart.
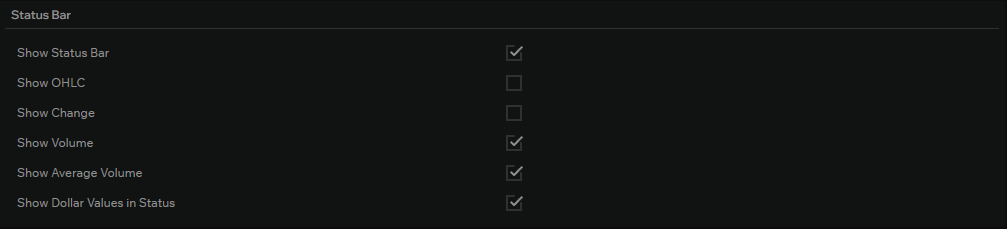
Show information — turn the top bar on or off.
Show OHLC — open, high, low, close of the candle under the cursor.
Show change — price change and percent change of the candle.
Show volume — volume of the candle under the cursor.
Show average volume — average volume over the last 20 candles from the one under the cursor.
Show dollar values in status — volumes in the status bar are shown in dollars instead of lots.
Screener densities
Shows screener densities on the chart. To see densities, Show screener densities must be enabled in general chart settings.
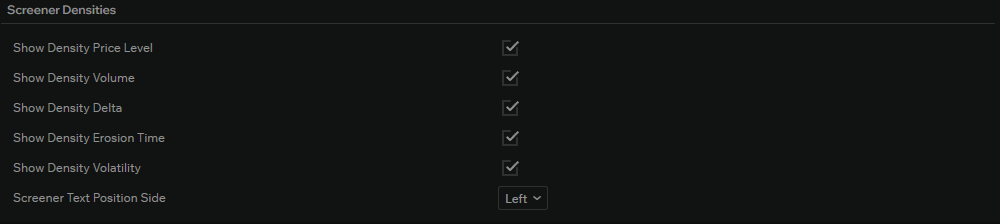
Show density price level — the price is shown above the density line.
Show density volume — shows the volume corresponding to the density on the chart.
Show density delta — change in volume since the density appeared.
Show density eat-through time — estimate of how long until the density is “eaten” at current activity on the pair.
Show density volatility — how much volume has actually traded at the density level; a value much higher than the initial volume suggests algorithm activity or density instability.
Density info side — left of the density start (by time) or right near the Y axis.
Indicator settings
Volume Profile
Horizontal volume profile: distribution of volume by price levels to the right of the chart.
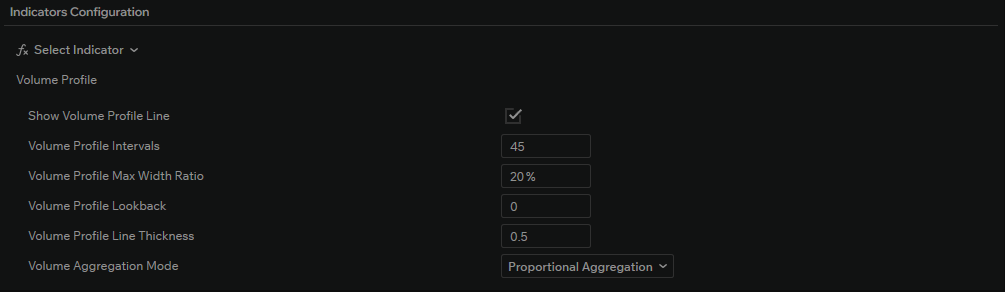
Show volume profile line — draw a horizontal line from the right edge of the chart to the first candle in the bucket with maximum volume (POC).
Volume profile interval count — number of price buckets (intervals) for volume distribution; recommended range 10–100.
Max profile width ratio — maximum width of volume blocks as a percentage of canvas width (default 20%).
Volume profile lookback — how many recent candles to use; 0 means all candles on the chart.
Volume profile line thickness — POC line thickness in pixels.
Volume aggregation mode — Sum: the full candle volume is added to each bucket the candle crosses; Proportional: volume is distributed across buckets in proportion to how much of the candle range falls in each bucket.
Scalping board
The indicator draws a table on the chart with daily volume, average volume, NATR (normalized ATR in %), correlation with a chosen ticker (default BTCUSDT), and for futures — funding rate and time to next funding. Cells are highlighted when values exceed their thresholds.
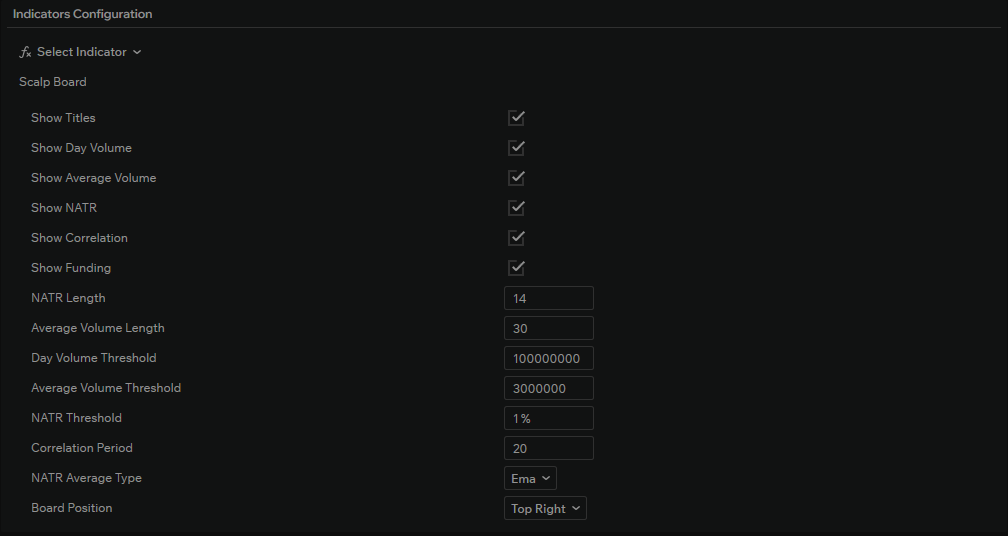
Block visibility:
Show titles — when enabled, short labels appear before values: DV (daily volume), AV (average volume), NATR, C (correlation).
Show daily volume — shows volume in monetary terms (volume × price) over the last 24 hours.
Show average volume — shows average volume in monetary terms over the last N candles (N set by “Average volume length”).
Show NATR — shows normalized ATR as a percentage of the last close (True Range is smoothed by the selected method and divided by price × 100).
Show correlation — shows Pearson correlation between closes of the current pair and the chosen ticker (default BINANCE:BTCUSDT) over the set period.
Show funding — for futures, shows funding rate and time to next funding; for spot this block is not shown.
Calculation parameters and thresholds:
NATR length — number of candles (period) for True Range before smoothing.
Average volume length — number of recent candles used to compute average volume (AV).
Daily volume threshold — when daily volume is above this value, the DV cell is highlighted.
Average volume threshold — when average volume is above this value, the AV cell is highlighted.
NATR threshold — when NATR is above this value, the NATR cell is highlighted.
Correlation period — number of candles used for the Pearson correlation between the two series.
Style and position:
NATR average type — method to smooth True Range before NATR: EMA, SMA, RMA (Wilder), WMA.
Board position — where the table is drawn on the chart: Top right, Bottom right, Center bottom, Left bottom, Left top.
Auto levels
The indicator builds potentially significant levels from touches and volume. Settings control what information is shown at each level and when a level is considered significant.
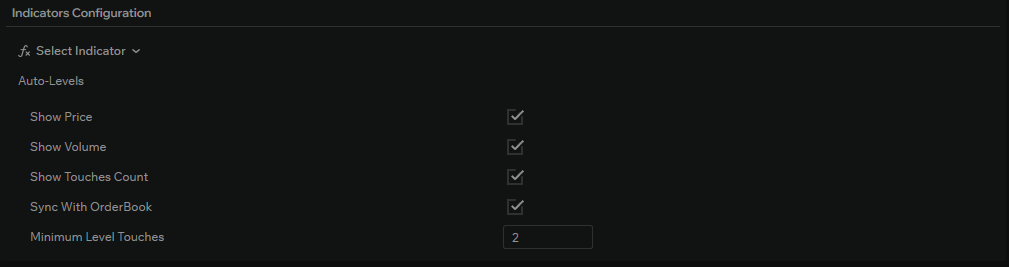
Show price — when enabled, the price value is shown at each auto level.
Show volume — when enabled, the volume at (or associated with) the level is shown.
Show touch count — when enabled, the number of touches (how many times price reached the level) is shown.
Sync with order book — when enabled, the same auto levels are shown in the order book; chart and order book levels match for the same pair.
Minimum touch count — threshold for a level to be considered significant; a level is shown only if its touch count is at least this value.
Heat map
The indicator shows the history of order book densities on the chart: horizontal segments by price and time, with bid and ask densities in different colours. Line thickness depends on density volume relative to a base volume. Clicking a density shows a tooltip with price and volume. Supported for Binance, Bitget, Bybit. Base volume is computed from the last N candles and used to filter and display densities.
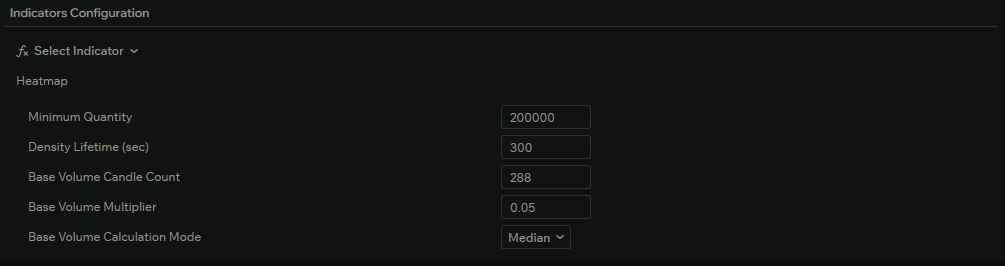
Minimum volume — densities with volume below this value are not shown. The effective threshold is at least this value and at least the computed base volume (to filter out small densities).
Density lifetime — minimum density duration in seconds. Only densities that existed for at least this long (difference between end and start time) are shown.
Base volume candle count — number of last chart candles used to compute base volume (volume × close). Base volume is used for the minimum volume filter and for relative line thickness of densities.
Base volume multiplier — multiplier applied to the computed base volume. The result sets the scale for which densities are selected and how they are drawn.
Base volume calculation mode — how base volume is computed from the selected candles: Average (arithmetic mean of volume in monetary terms) or Median, then the base volume multiplier is applied.