
Structure
The Chart tool shows the chart for the selected trading pair on the selected exchange: volumes, candles, orders, positions, and indicators. It works well together with the order book and other tools — pairs can be synced across windows via linking.
Instrument layout
The chart interface is split into two parts:
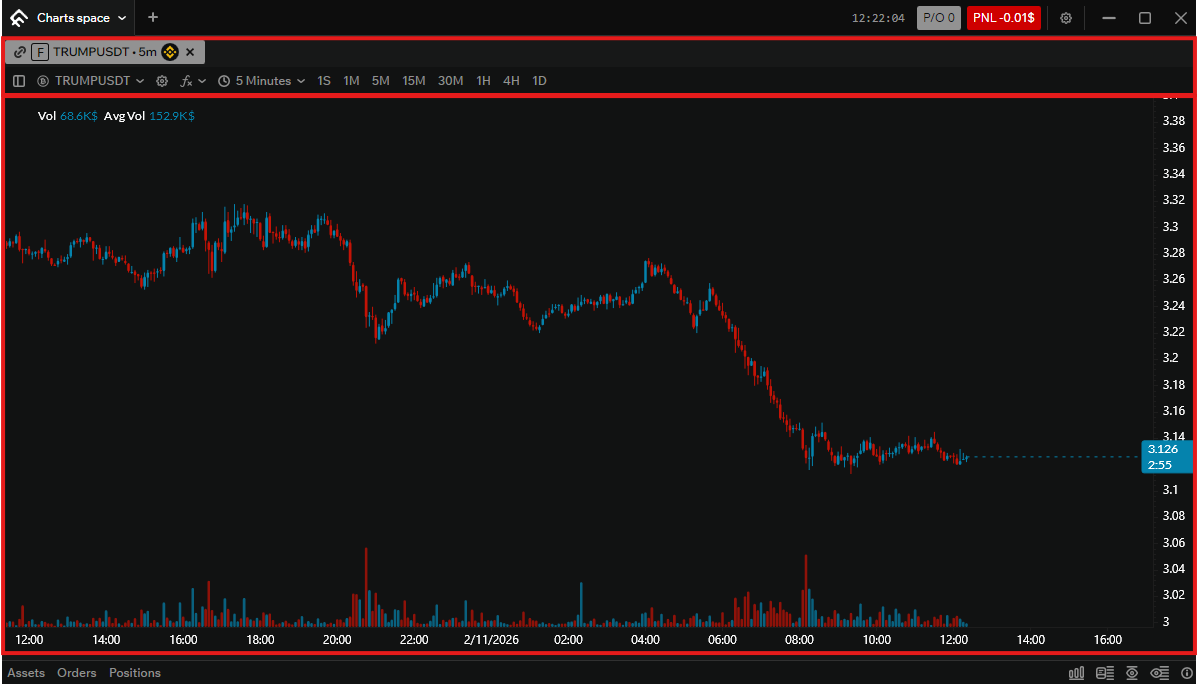
- Top — control panel: link type, market type, pair, exchange, and window close; and directly below it the drawing panel: pair search and filters, settings, indicators, timeframe dropdown, and quick timeframe panel.
- Bottom — the chart itself with two axes, X for time and Y for price. Candle volumes sit below the chart; indicators overlay the chart.
Both zones are described in more detail below.
Control panel
The instrument header contains controls for pair, exchange, and market type.

Link type
You can choose one of 20 link colors. Tools (order books, charts, etc.) that share the same color sync the pair between them: changing the pair in one window updates it in all windows with that color.
A special option is active link. With active link, the pair in the current tool is set by clicking another tool.
Example
The current tool has pair KAITOUSDT and active link is on. If you click a tool that has pair BTCUSDT, the first tool will switch to BTCUSDT.
F/S toggle
The F/S button switches market type: S — Spot, F — Futures. The choice is tied to this window and does not change until you press the toggle again or select a pair of a different market type in this tool.
Pair label
The selected pair (symbol) is shown in the center, e.g. KAITOUSDT — so you can quickly see which pair is open in which window.
Exchange selection
A dropdown lists exchanges. The selected exchange stays fixed to this tool until you unfix it or choose another. All exchanges shown in Availability are available (up to 10 exchanges).
Close tool
The close (X) button closes the Chart tool window.
Below the control panel
Just under the header there are several blocks: pair selection, chart settings, indicator selection, and timeframe selection via dropdown and quick-access panel.
Pair selection (left)
On the left is a field showing the selected pair (as placeholder). Clicking it opens pair search. The search lists all available pairs from connected exchanges.
The search window has filters: you can narrow by market type (spot/futures) and by exchange, so it’s easier to find the pair you need.
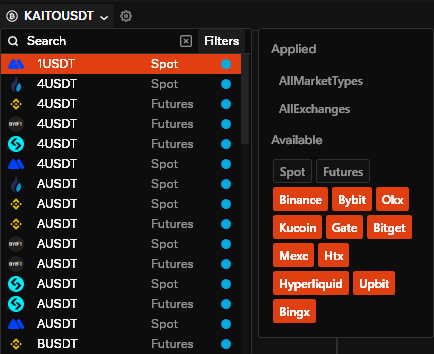
Chart settings (right)
On the right is the chart settings button. Clicking it opens the global settings panel where you can fine-tune the charts. For more details, see the Settings tab.
Indicator selection
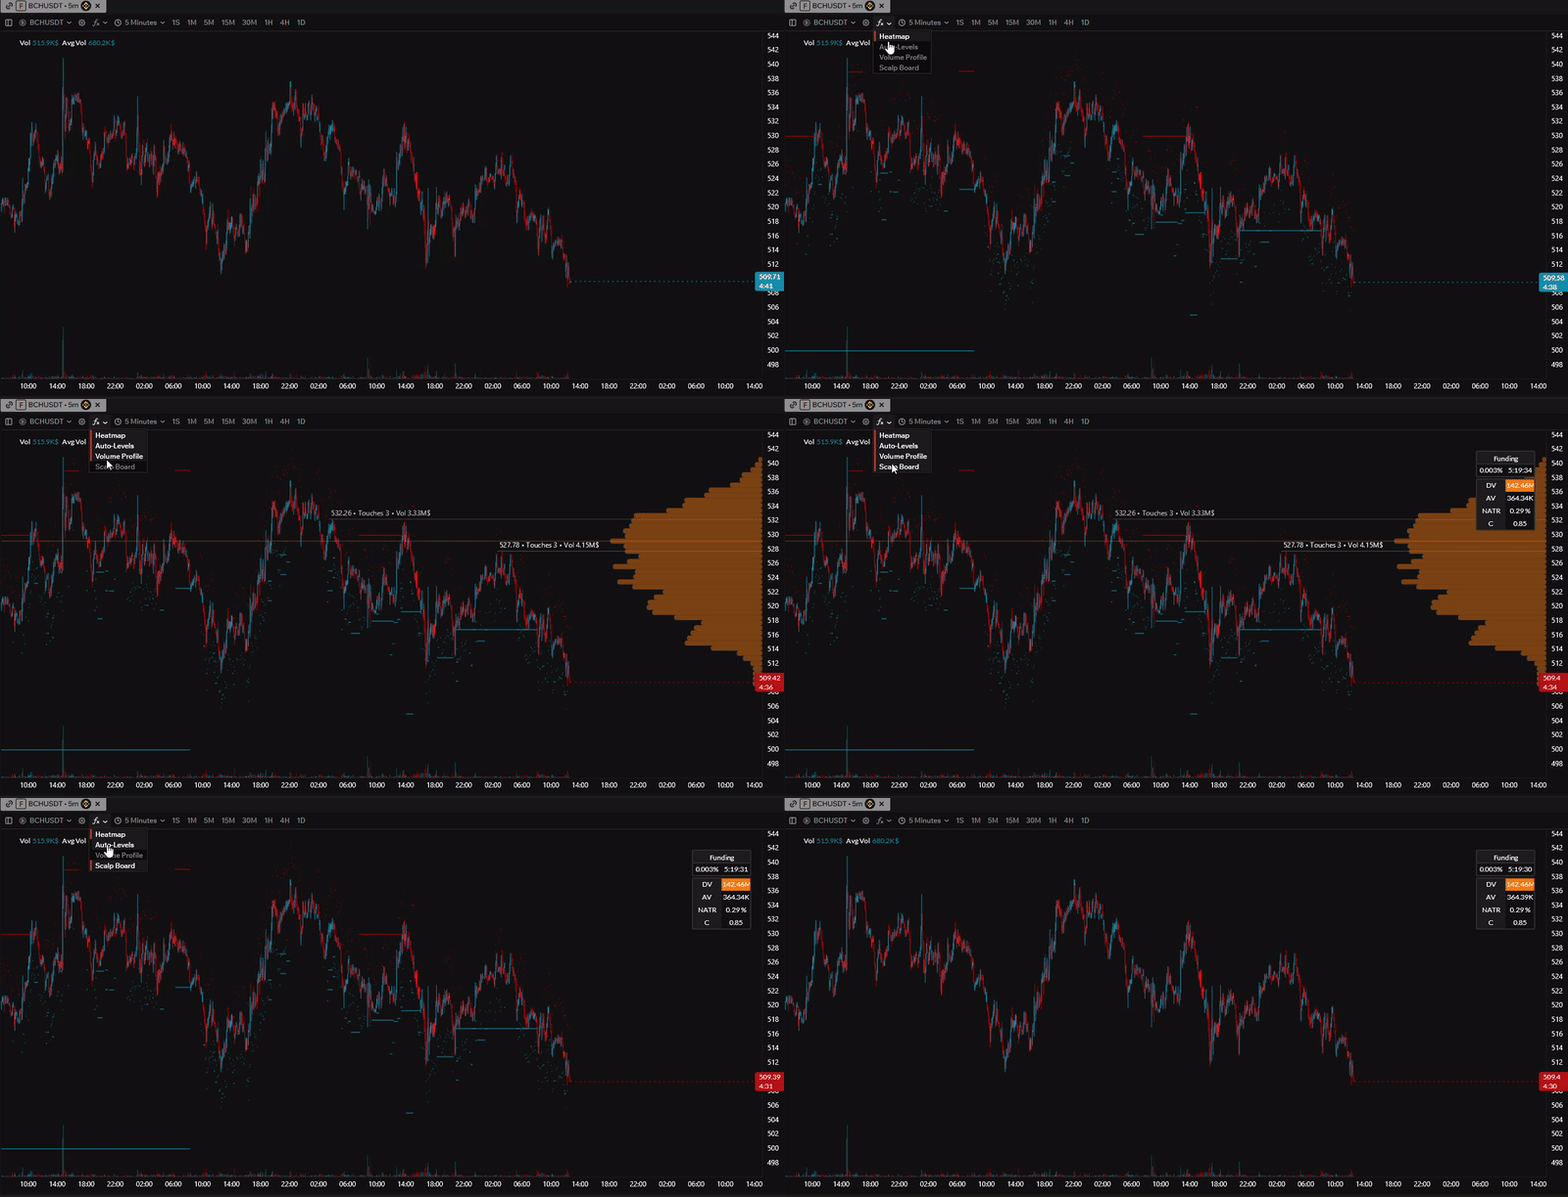
The terminal currently offers 4 indicators; all are overlaid on the chart. All indicator settings are described in chart settings.
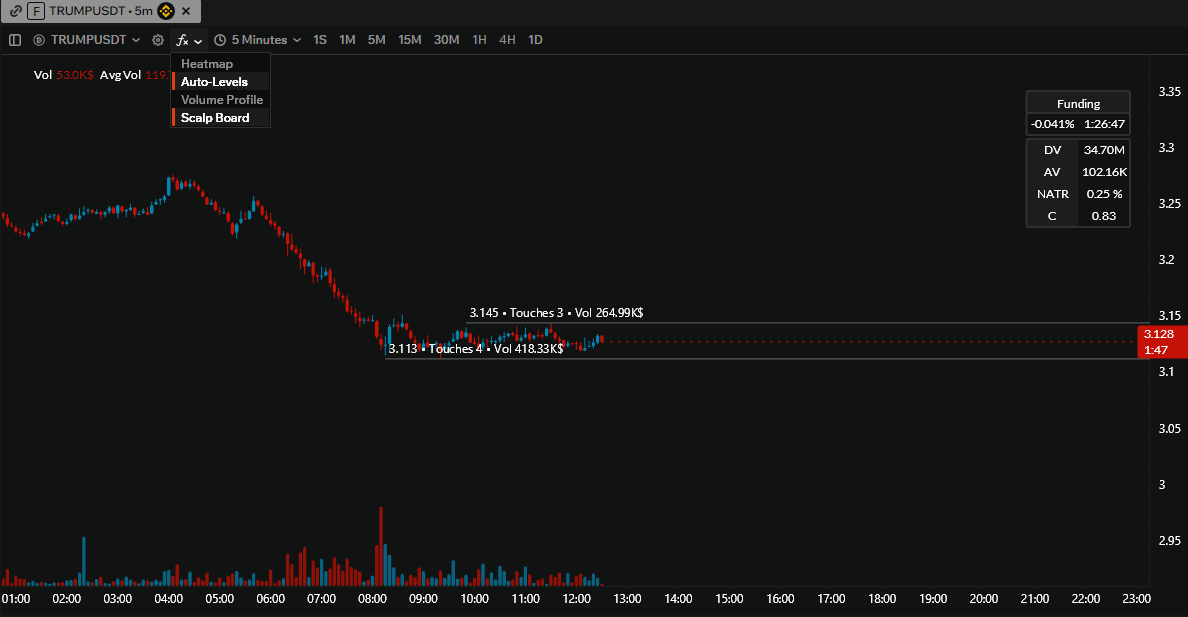
- Heat map — shows the history of densities on the chart; controlled via multiplier (default A + scroll) and indicator settings.
- Auto levels — draw potentially significant levels automatically. The algorithm is based on touches and volumes around levels.
- Scalping board — shows overall information useful for decisions: funding, daily volume, average volume, ATR, and correlation with Bitcoin.
Timeframe selection
There are two ways to choose a timeframe: a dropdown with all timeframes available for the exchange, and a quick-select panel to the right of the dropdown with the most popular timeframes for trading.
The terminal also supports second-based charts from 1s to 30s.
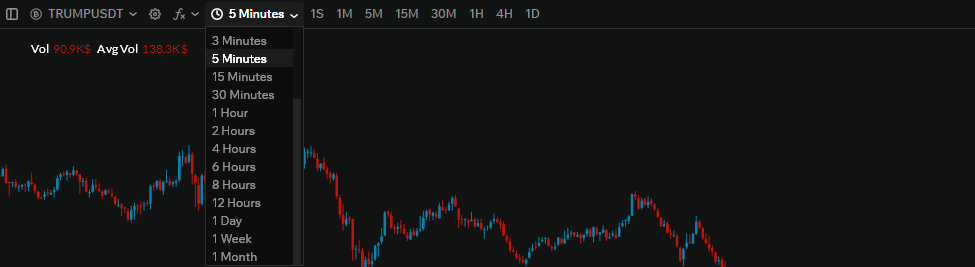
Chart area
The chart is displayed at the bottom with two axes: horizontal (X) — time, vertical (Y) — price. Candle volumes are shown below the chart. Selected indicators are overlaid on the chart.