
Structure
The Quotes tool shows a table of trading pairs with prices and metrics for the exchanges and market types you choose. You can use it together with the chart and other tools to track multiple pairs and quickly compare data.
Opening Quotes
To open the Quotes tool, click the Quotes icon in the lower menu of the application. The icon opens the quotes interface in the current workspace.

Instrument layout
The quotes interface is split into two areas:
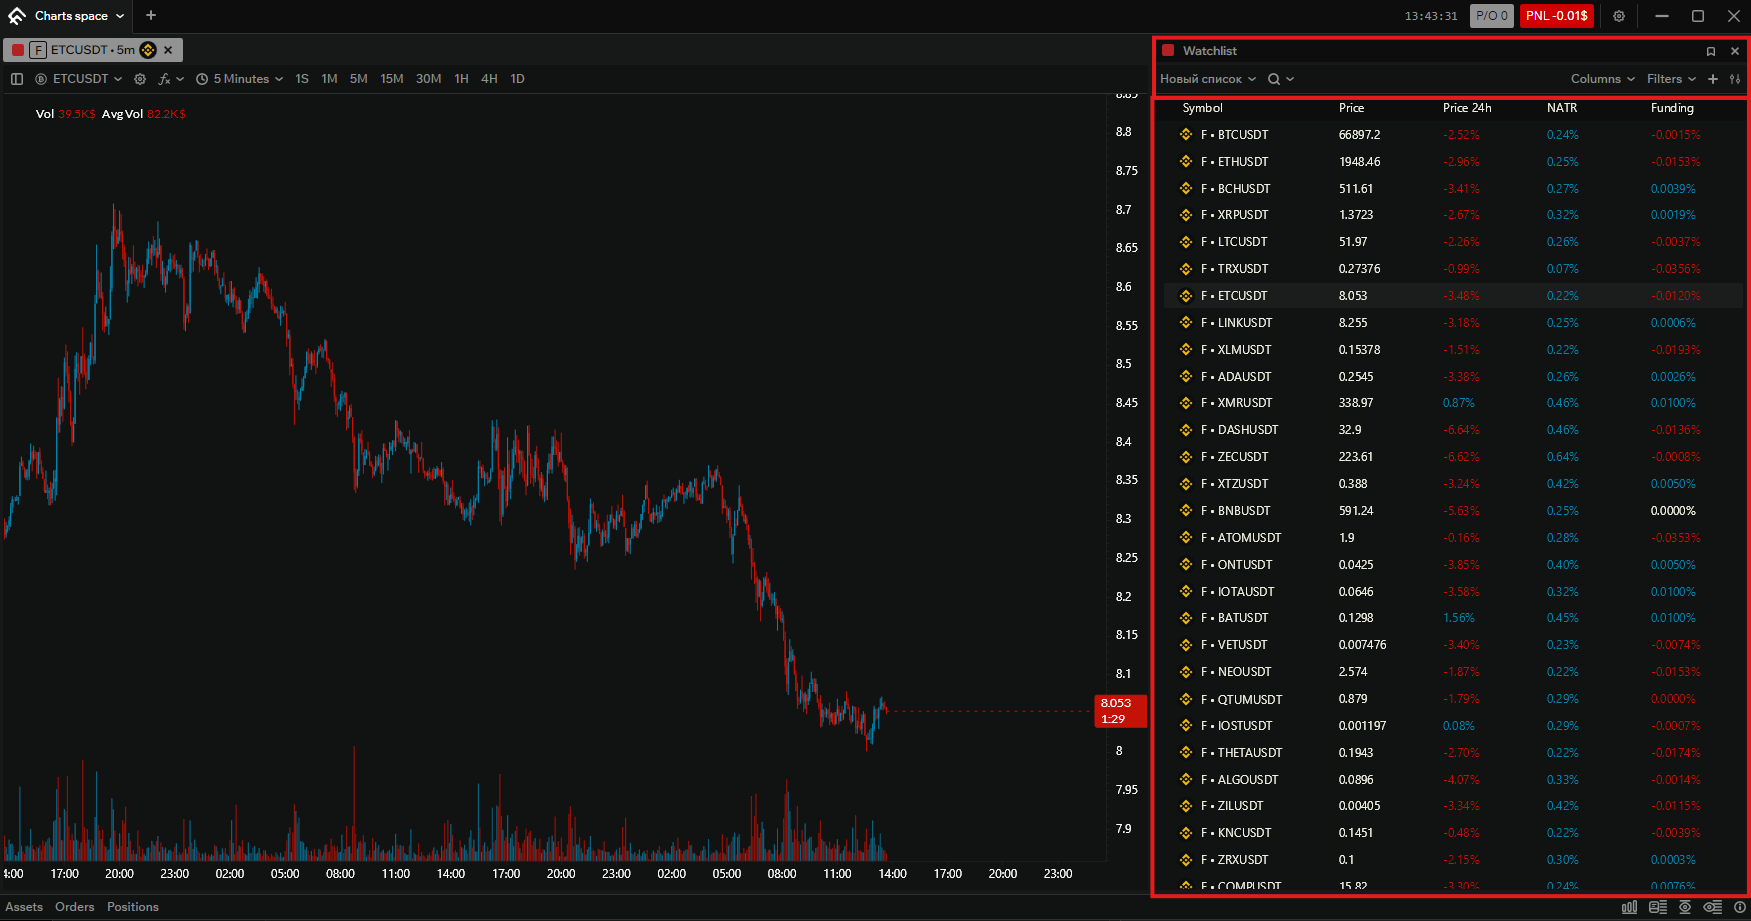
- Top — control bar: watchlist selector, symbol search, columns, filters, add exchanges (+), and settings.
- Bottom — quotes table: rows for each pair (symbol with exchange icon), columns for the metrics you enable (price, volume, change %, NATR, funding, and others).
Each area is described in more detail below.
Control panel
The bar at the top holds all controls for the current watchlist, from left to right.
Watchlist selector
The dropdown shows the name of the active watchlist. You can switch between saved lists or create new ones. The list you select determines which pairs and filter settings are shown.
Symbol search
Clicking the search field opens symbol search. You can type to find a pair quickly in the table.
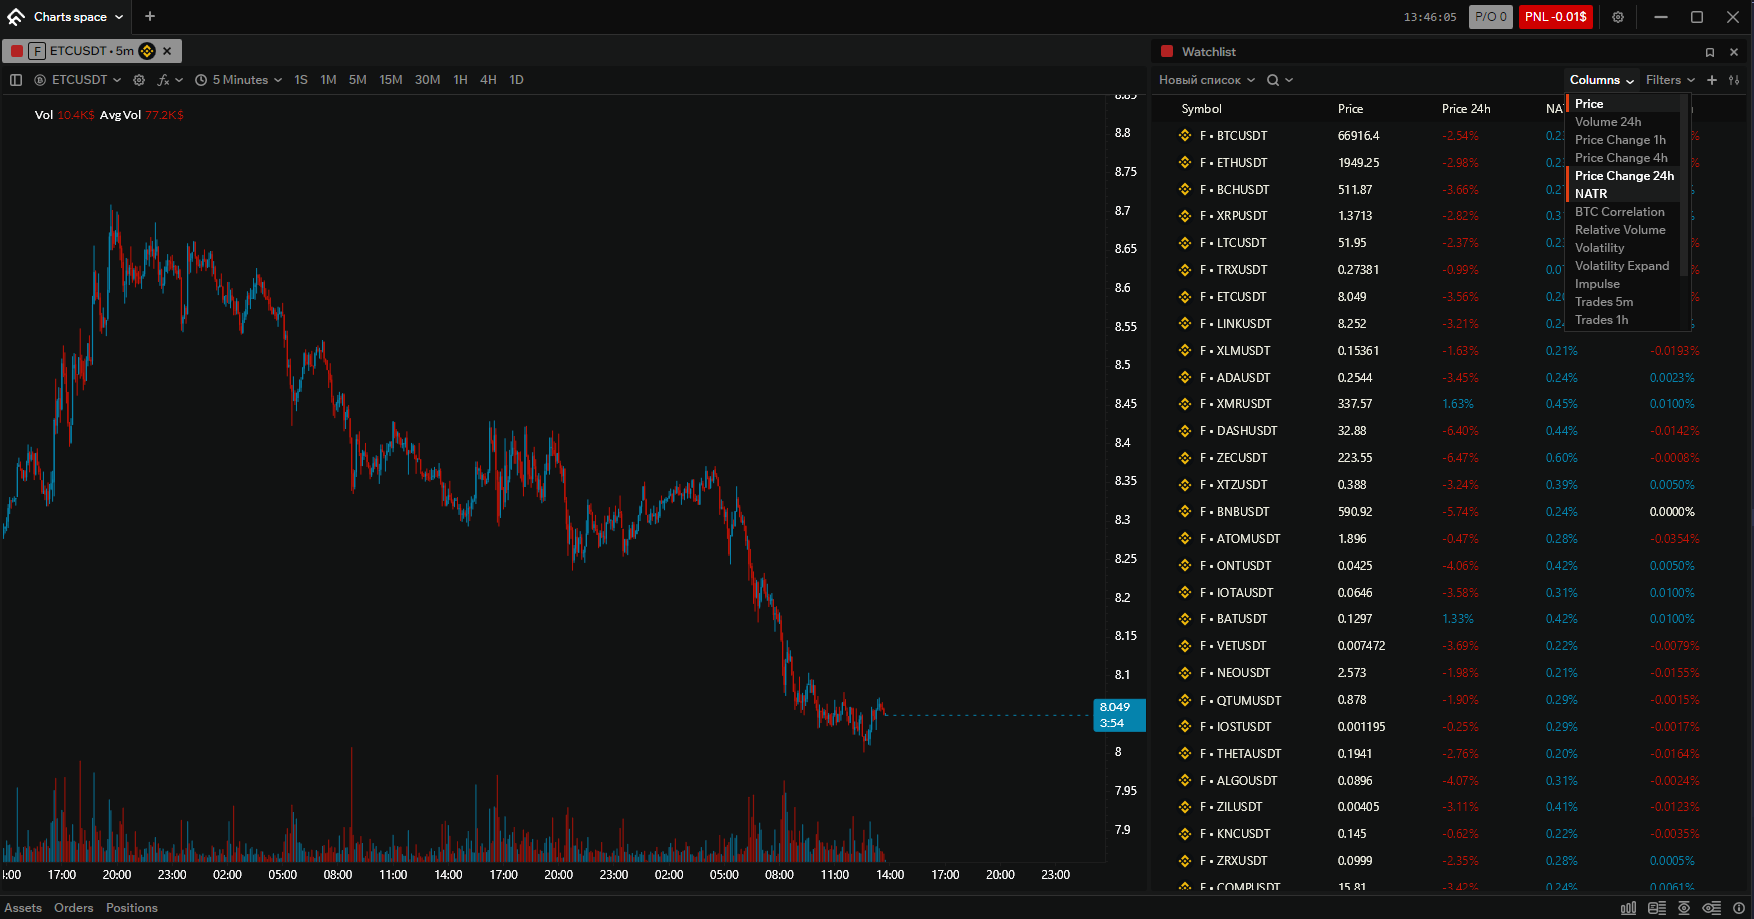
Columns
The Columns dropdown lets you choose which metrics appear as columns in the table. You can turn on or off fields such as price, 24h volume, price change (1h, 4h, 24h), NATR, BTC correlation, relative volume, volatility, impulse, trade counts (5m, 1h, 4h, 24h), volume expansion, and funding.
Filters
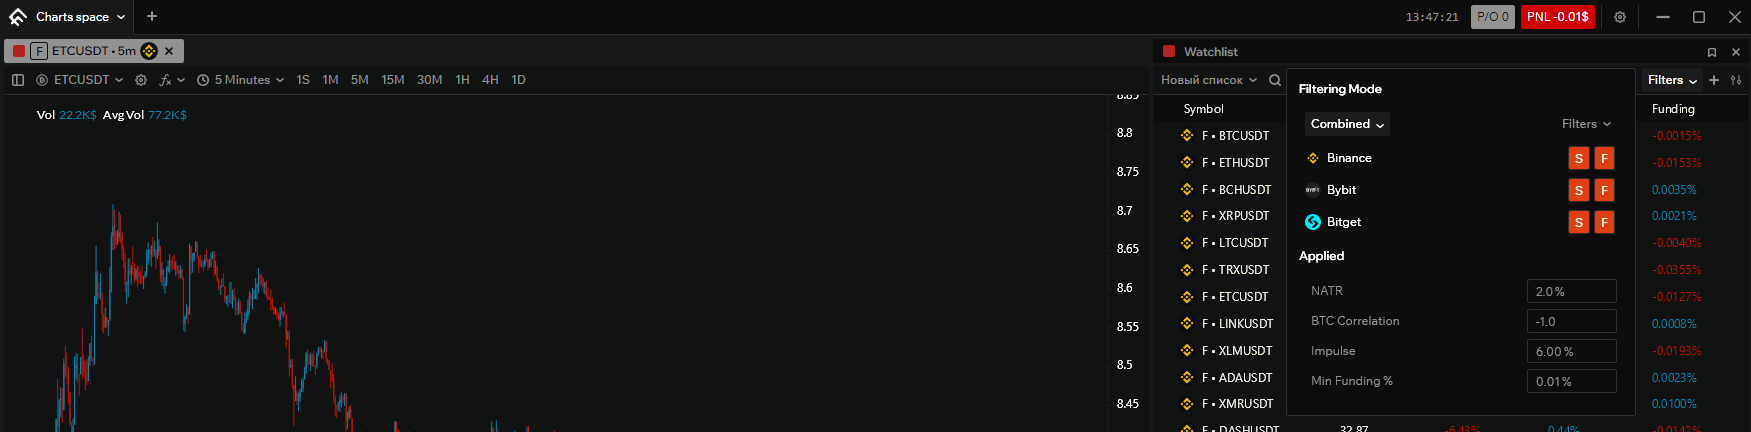
The Filters dropdown sets the filtering mode and, when filtering is enabled, which criteria and thresholds to apply. You can also choose which exchanges and market types (Spot / Futures) are used for filtered results.
- With mode Disabled, the table shows only pairs you added manually (and any instruments in groups).
- With Combined, the table shows both manually added pairs and pairs that pass the filter thresholds. Pairs that pass the filters are highlighted with a semi-transparent color (the color can be set in appearance settings).
- With Active, the table shows only pairs that pass the filters (and instruments in groups, if applicable). The + button is hidden.
When filtering is on, you can set thresholds for price, 24h volume, NATR, BTC correlation, relative volume, price change over 1h/4h/24h, volatility, impulse, trade counts over 5m/1h/4h/24h, volume expansion, and funding. Only pairs meeting your criteria appear (or are added to the list in Combined mode with row highlighting).

Add exchanges (+)
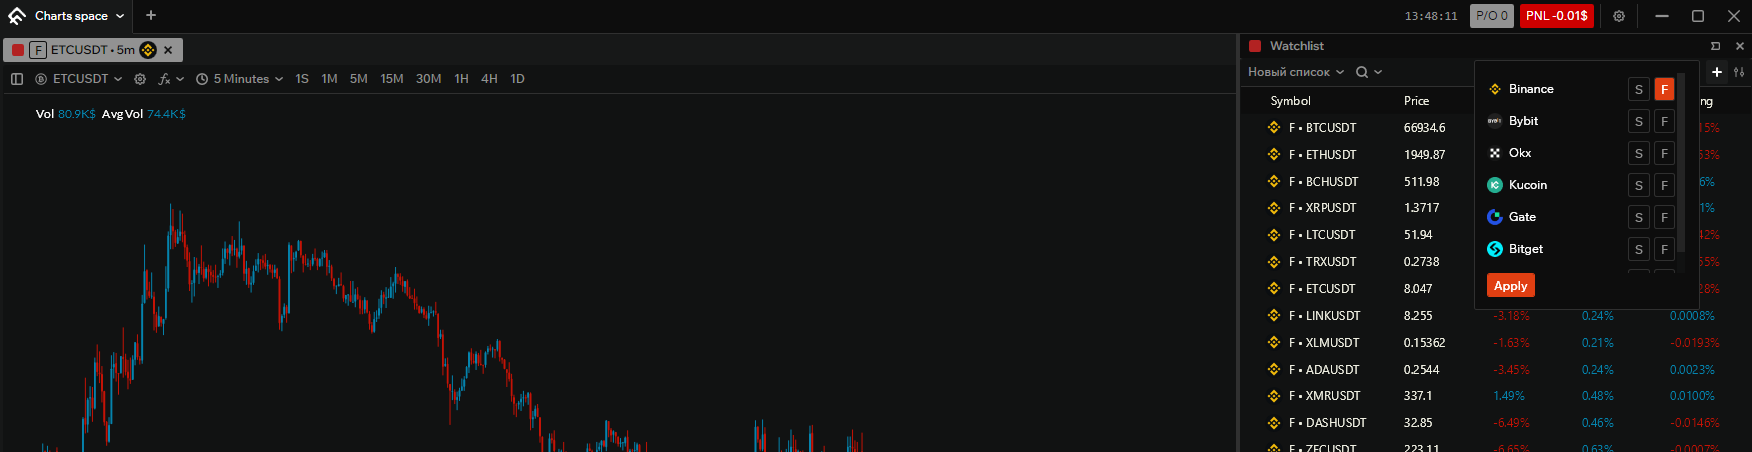
The + button opens a panel for adding pairs to the watchlist by exchange and market type. For each exchange (e.g. Binance, Bybit, OKX), the S (Spot) and F (Futures) toggles choose which pairs to add. After selecting, click Apply to add all pairs for the chosen exchanges and types to the current list. This button is hidden when filtering mode is Active.
Settings
The settings icon opens a menu for managing the current watchlist:
- Create — create a new watchlist.
- Rename — rename the active watchlist.
- Clear — remove all pairs from the active watchlist.
- Delete — delete the active watchlist (at least one list must remain).

Filtering modes
- Disabled — the table shows only pairs you added via the + button and any instruments you put in groups. No automatic filtering by thresholds.
- Combined — the table shows your manually added pairs plus pairs that pass the filter criteria (price, volume, NATR, and so on). You choose which filters are active and their thresholds, and which exchanges/market types are used for filtering. Pairs that pass the filters are highlighted with a semi-transparent color (the color can be set in appearance settings).
- Active — the table shows only pairs that pass the filters (and group instruments). The + button is not shown; the list is driven entirely by your filter settings and thresholds.
Quotes table
The quotes table fills the area below the control bar. Each row is one trading pair: the symbol is shown with an exchange icon. The columns are the metrics you enabled in the Columns dropdown (e.g. price, 24h volume, price change %, NATR, BTC correlation, volatility, funding).
The selected row is highlighted. It can be synced with the chart or other tools so you can see which pair is in focus; to do that, choose the same link color in the quotes header as in the other tool. On the left edge of the table, colored bookmarks indicate groups: you can assign pairs to groups (e.g. by strategy or watchlist) and quickly spot them by color.
Right-click a row to open the context menu: add the pair to a group, remove from all groups, set as “set of instruments” (linked tools), or set as “set of all exchanges by pair” (see Workspace) to see the same symbol across exchanges. These options help you organise the list and link the quotes tool to the chart or order book.