
Structure
The Screener tool shows large densities (big limit orders sitting in the order book) across the exchanges and market types you choose. All densities are plotted on a single map, so you can quickly see where significant levels are, how close they are to the current price, and how large they are.
Opening the Screener
To open the Screener tool, click the Screener icon in the lower menu of the application. The icon opens the screener interface in the current workspace.

Instrument layout
The screener interface is split into two areas:
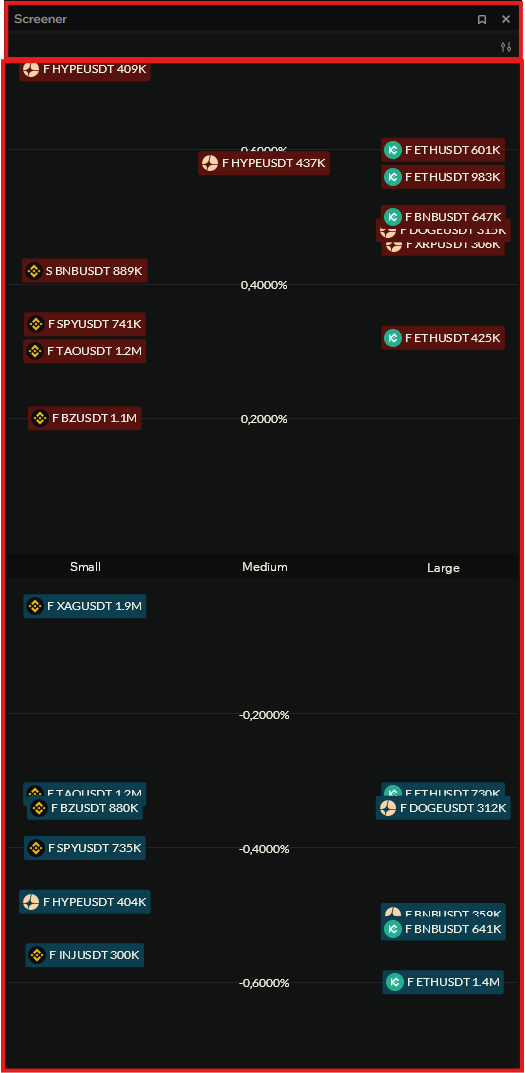
- Top — instrument header: the "Screener" title, a hide icon, a close button, and a button that opens the settings.
- Bottom — density map: markers for trading pairs, distributed by price change percentage (vertical axis) and density size (horizontal axis).
Each area is described in more detail below.
Instrument header
The top of the window holds the controls for the instrument:
- Linking — the bookmark icon to the right of the title. Clicking it hides the window and creates a bookmark.
- Close — the cross button closes the instrument in the current workspace.
- Settings — the slider icon below the close button. Opens the screener settings, where you configure exchanges, density filters, alerts, and the currency pair filter.
Density map
The main area of the instrument is the density map. Each marker on the map represents a single density for one trading pair on a specific exchange and market type.
Map axes
- Vertical axis — price change percentage relative to the current price of the pair. Positive values (above zero) mean the density is above the current price (a potential resistance level). Negative values (below zero) mean the density is below the current price (a potential support level). The grid step is set automatically (e.g. 0.2%, 0.4%, 0.6%).
- Horizontal axis — density size relative to the base volume of the instrument. Split into three categories: Small, Medium, and Large. The thresholds for each category are set by multipliers in the exchange settings (see Settings).
Density marker
Each marker contains the key information about the density:
- Exchange icon — which exchange the density is on (Binance, Bybit, Kucoin, Aster, etc.).
- Market type — the letter before the symbol: S for spot, F for futures.
- Pair symbol — e.g.
BNBUSDT,ETHUSDT,HYPEUSDT. - Density volume — the size of the density in monetary terms (e.g.
889K,1.2M).
Marker color
The marker color shows the direction relative to the current price:
- Red — a sell density, sitting above the current price (positive percentage on the vertical axis).
- Blue — a buy density, sitting below the current price (negative percentage on the vertical axis).
The further the density is from the current price, the higher or lower its marker sits on the map. This lets you see at a glance where major levels are concentrated relative to the market.
Different exchanges
The map shows densities only for the exchanges and market types enabled in the screener settings. For each "exchange + market type" combination (e.g. Binance Futures, Kucoin Spot), you set an independent set of density calculation parameters — minimum volume, base volume calculation method, distance from spread, multipliers for the "Medium" and "Large" categories, and more. See the Settings section for a detailed description of each parameter.