
Structure
The Order Book tool shows the depth for the selected trading pair on the selected exchange: buy and sell orders, volume clusters, and the stream of trade ticks. It works well together with charts and other tools — pairs can be synced across windows via linking.
Instrument layout
The order book interface is split into four areas:
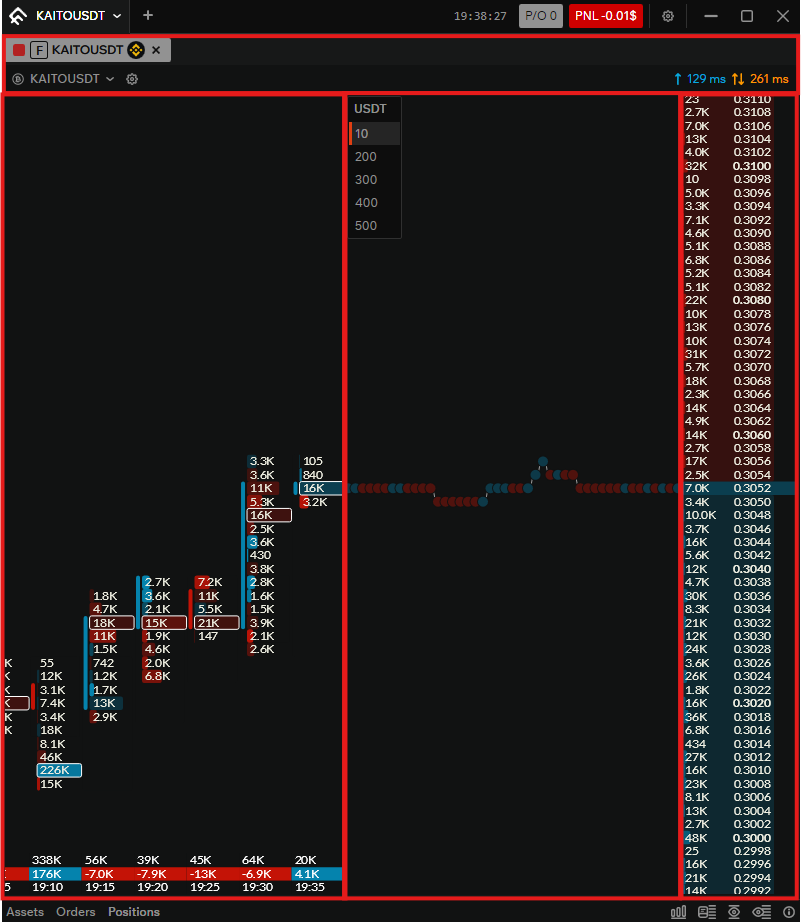
- Top — control panel: link type, market type (spot/futures), pair, exchange, and window close.
- Bottom left — cluster zone: volumes grouped by the selected time interval.
- Bottom center — trade ticks zone: real-time stream of trades.
- Bottom right — order book: price levels and volumes (bids and asks).
Each area and the control panel are described in more detail below.
Control panel
The instrument header contains controls for pair, exchange, and market type.

Link type
You can choose one of 20 link colors. Tools (order books, charts, etc.) that share the same color sync the pair between them: changing the pair in one window updates it in all windows with that color.
A special option is active link. With active link, the pair in the current tool is set by clicking another tool. For example: the current tool has pair KAITOUSDT and active link is on. If you click a tool that has pair BTCUSDT, the first tool will switch to BTCUSDT.
F/S toggle
The F/S button switches market type: S — Spot, F — Futures. The choice is tied to this window and does not change until you press the toggle again or select a pair of a different market type in this tool.
Pair label
The selected pair (symbol) is shown in the center, e.g. KAITOUSDT — so you can quickly see which pair is open in which window.
Exchange selection
A dropdown lists exchanges. The selected exchange stays fixed to this tool until you unfix it or choose another. All exchanges shown in Availability are available (up to 10 exchanges).
Close tool
The close (X) button closes the Order Book tool window.
Below the control panel
Just under the header there are two blocks: pair search and order book settings; in the bottom right, after the settings, pings are displayed.
Pair search (left)
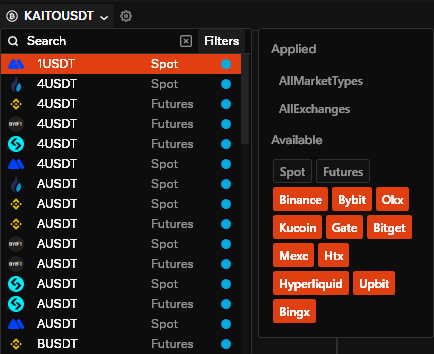
On the left is a field showing the selected pair (as placeholder). Clicking it opens pair search. The search lists all available pairs from connected exchanges.
The search window has filters: you can narrow by market type (spot/futures) and by exchange, so it’s easier to find the pair you need.
Order book settings (right)
On the right is the settings button for the current order book. Clicking it opens the local settings panel where you can fine-tune how the depth, ticks, and clusters are displayed.
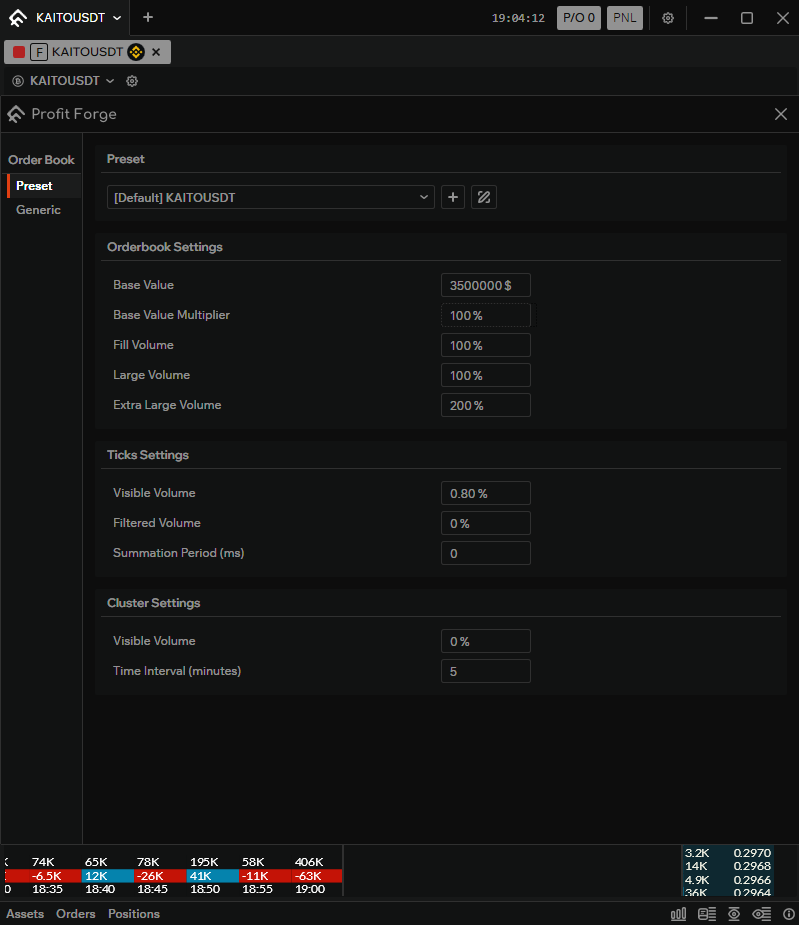
Available options:
- Base value — the base from which other values are calculated. It is obtained after automatic calculation of order book values (see Auto-calculation of volumes).
- Base value multiplier — the multiplier applied to the base value before it is used for subsequent volume calculations in the order book.
- Volume fill — volume threshold for cell fill.
- Large volume and very large volume — thresholds for highlighting large volumes.
- Visible tick volume — which tick volume to show.
- Filtered tick volume — volume threshold for filtering ticks.
- Tick aggregation period — time interval for aggregating ticks.
- Visible cluster volume — how cluster volume is displayed.
- Cluster time interval — time step for clusters.
Pings
In the bottom right corner, after the settings button, pings are shown — metrics for connection latency to the exchange.
In the upper part of the order book two ping metrics are displayed, each important for analysing connection speed:
- Left ping (up arrow, e.g. 129 ms) — one-way ping, i.e. the time for a signal from the terminal to reach the exchange servers. It reflects how quickly an order open or cancel command is sent. In the example, 129 ms is the time from a click in the order book to order registration on the exchange.
- Right ping (up and down arrows, e.g. 258 ms) — round-trip ping, i.e. the full time for a signal to reach the exchange and return to the terminal. Typically this ping is about twice the one-way value, though it can differ under high market activity. Round-trip reflects the overall state of the channel to the exchange, while one-way shows the delay on the specific server that processes orders for this order book.
To reduce pings and optimise the route to the exchange, you can use proxy settings.
Cluster zone
The cluster zone at the bottom left displays a chart built on real-time trades directly in the order book.
Trades are shown in cell format: each cell shows how much was traded at that price level over the interval, with color indicating the dominant side — shorts (sells) or longs (buys).
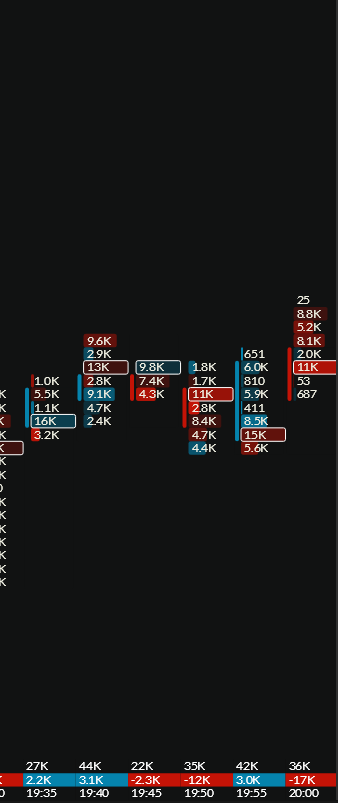
Below each cluster, information is shown from top to bottom:
- Total volume for the interval — total traded volume across all price levels in that time interval.
- Dominant side advantage — how much more volume the dominant side (buyers or sellers) has in the interval; positive values indicate buyer dominance, negative values indicate seller dominance.
- Interval time — the timestamp for the interval candle, similar to the time axis on a candlestick chart.
The time interval and visible cluster volume are set in order book settings.
TIP
Double-clicking the cluster zone hides the ticks zone and expands the cluster zone into its place. Double-click again to restore the layout.
Trade ticks zone
The trade ticks zone in the center bottom shows the real-time stream of trades. The trades themselves are displayed with price, volume, and side (buy/sell), highlighted by color.
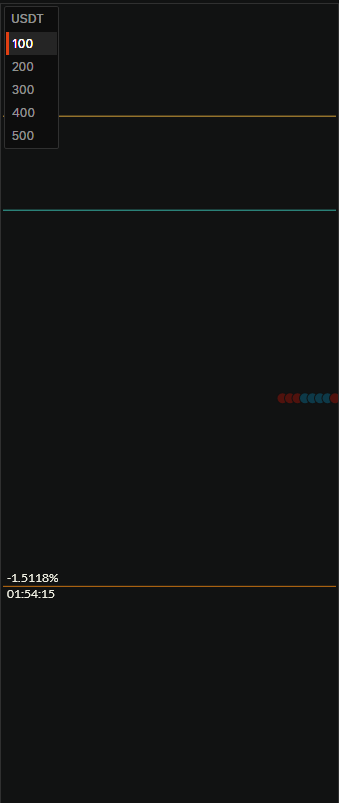
This zone also shows:
- Levels — horizontal lines for levels set in the order book or on the chart (e.g. signal levels or density change levels).
- Funding — funding rate and time until the next funding; relevant for futures pairs.
- Trading volumes — preset volumes (e.g. 100, 200, 300 USDT) used to place orders quickly in the order book; the selected volume is highlighted. You can switch the display mode between lots and dollars depending on your preference.
Volume thresholds and tick aggregation are set in order book settings to filter noise and emphasize significant trades.
TIP
Double-clicking the ticks zone hides the cluster zone and expands the ticks zone into its place. Double-click again to restore the layout.
Order book
The order book on the bottom right is a vertical list of price levels with volumes. The top half shows sell orders (asks), the bottom half buy orders (bids), each side in its own color (e.g. red for asks, blue for bids). The spread — best ask and best bid — is visible at the centre.
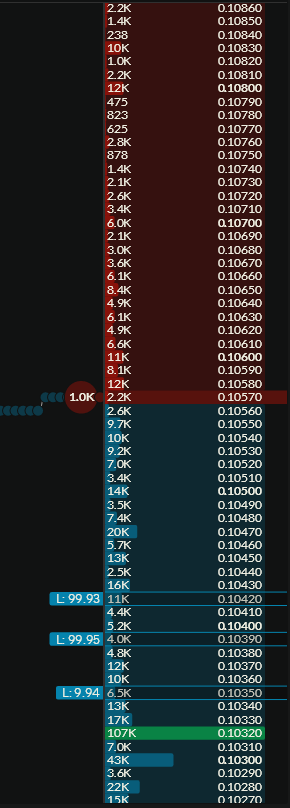
Large volumes are highlighted with stronger, contrasting colors: the bigger the volume at a level, the more prominent the highlight. This makes it easier to trade densities and see where liquidity is concentrated in the book. Large and very large volumes may use distinct colors (e.g. green for large, purple for very large).
The book also shows your orders and position — markers (e.g. “L:” with volume) indicate which levels have your limit orders and where your position sits. This helps you track distance in the book and quickly assess market depth for the selected pair and exchange.